What did I do in 2021?
Tracking my work and non-work time.
What is this?
I started tracking my work activities in 2019 to make sure I wasn’t overworking myself and to better understand how I spent my time. A year ago, I analyzed my work activities for 2019 and 2020 and found that I tended to work ~40-45 hrs in an average week, which seems reasonable, but I would often spend an hour or two working over the weekend, which I didn’t like. Additionally, the amount of time I spent on research activities was decreasing, paired with an increase in logistics (stuff like checking emails, doing project management, etc.).
Based on the 2019-2020 data, I set two goals:
- Take at least one day per weekend with 0 work hours (preferably both).
- Reduce the amount of time spent on logistics.
With another year of data, I can we see whether I’ve been able to meet these goals, and look at two questions: how much do I work, and what do I do when I’m working?
For those interested, here’s the raw data for 2019, 2020, and 2021. If you want to try this yourself, feel free to copy the spreadsheet and track your own hours - I just keep it open as a pinned tab and try to fill it a couple times a day. Here is a script that can scrape the data from Google Sheets into a CSV file, and here is the code for this blog post.
Update 2023/01/07: See here for the updated stats with 2022 data.
How much do I work?
In 2021, my hour count remained pretty consistent with past years, fluctuating around 40-45 hrs with occasional spikes associated with field work and/or conferences:
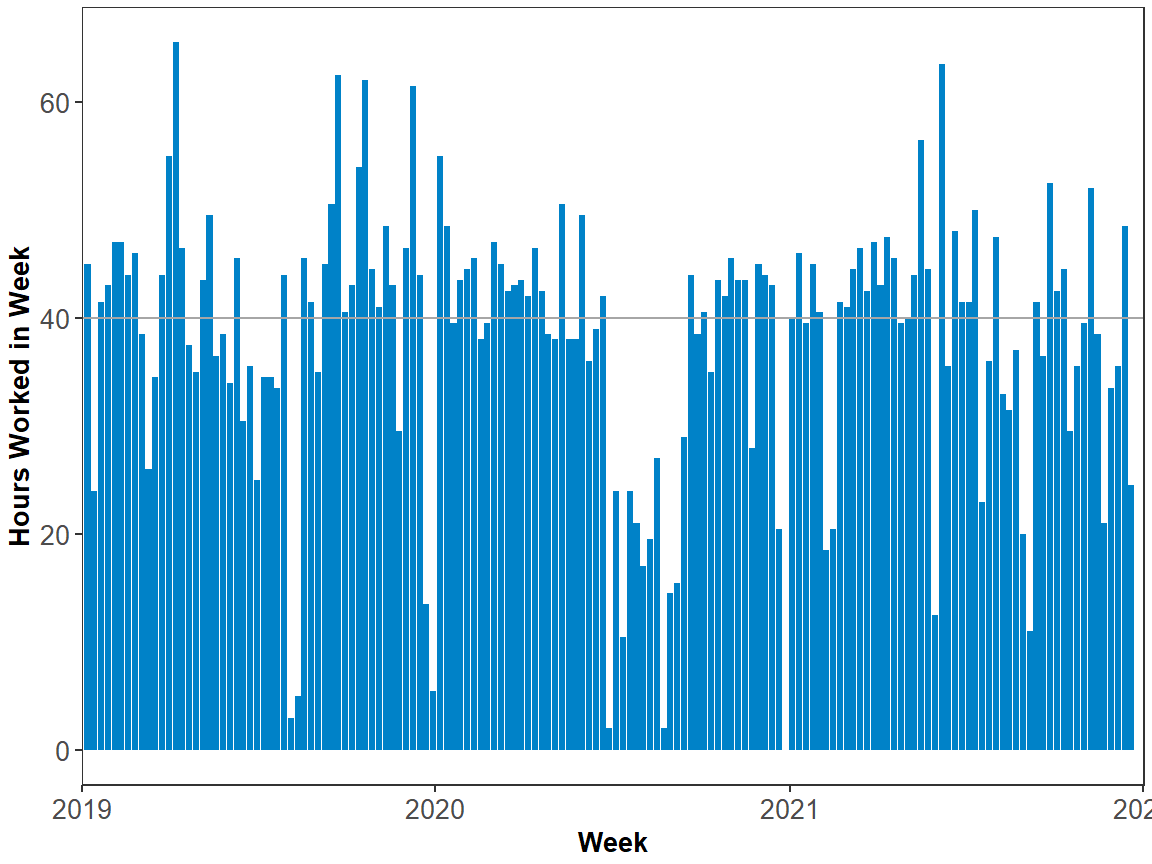
The dip in mid-2020 is a period of partial parental leave (I extended my leave by working part-time, rather than taking one large chunk). In total, I worked 1980.5 hours in 2021, compared to 1838 hours in 2020 and 2070 hours in 2019. This translated to a median weekly hour count of 40.75 hours in 2021 (2020 = 40.5 hrs, 2019 = 43 hrs).
My goals mostly focused on my daily work. While I never worked long days on weekends, I would often check my email during kid naptime, and I wanted to avoid this so I would have more days with 0 hours worked. This, overall, was successful:
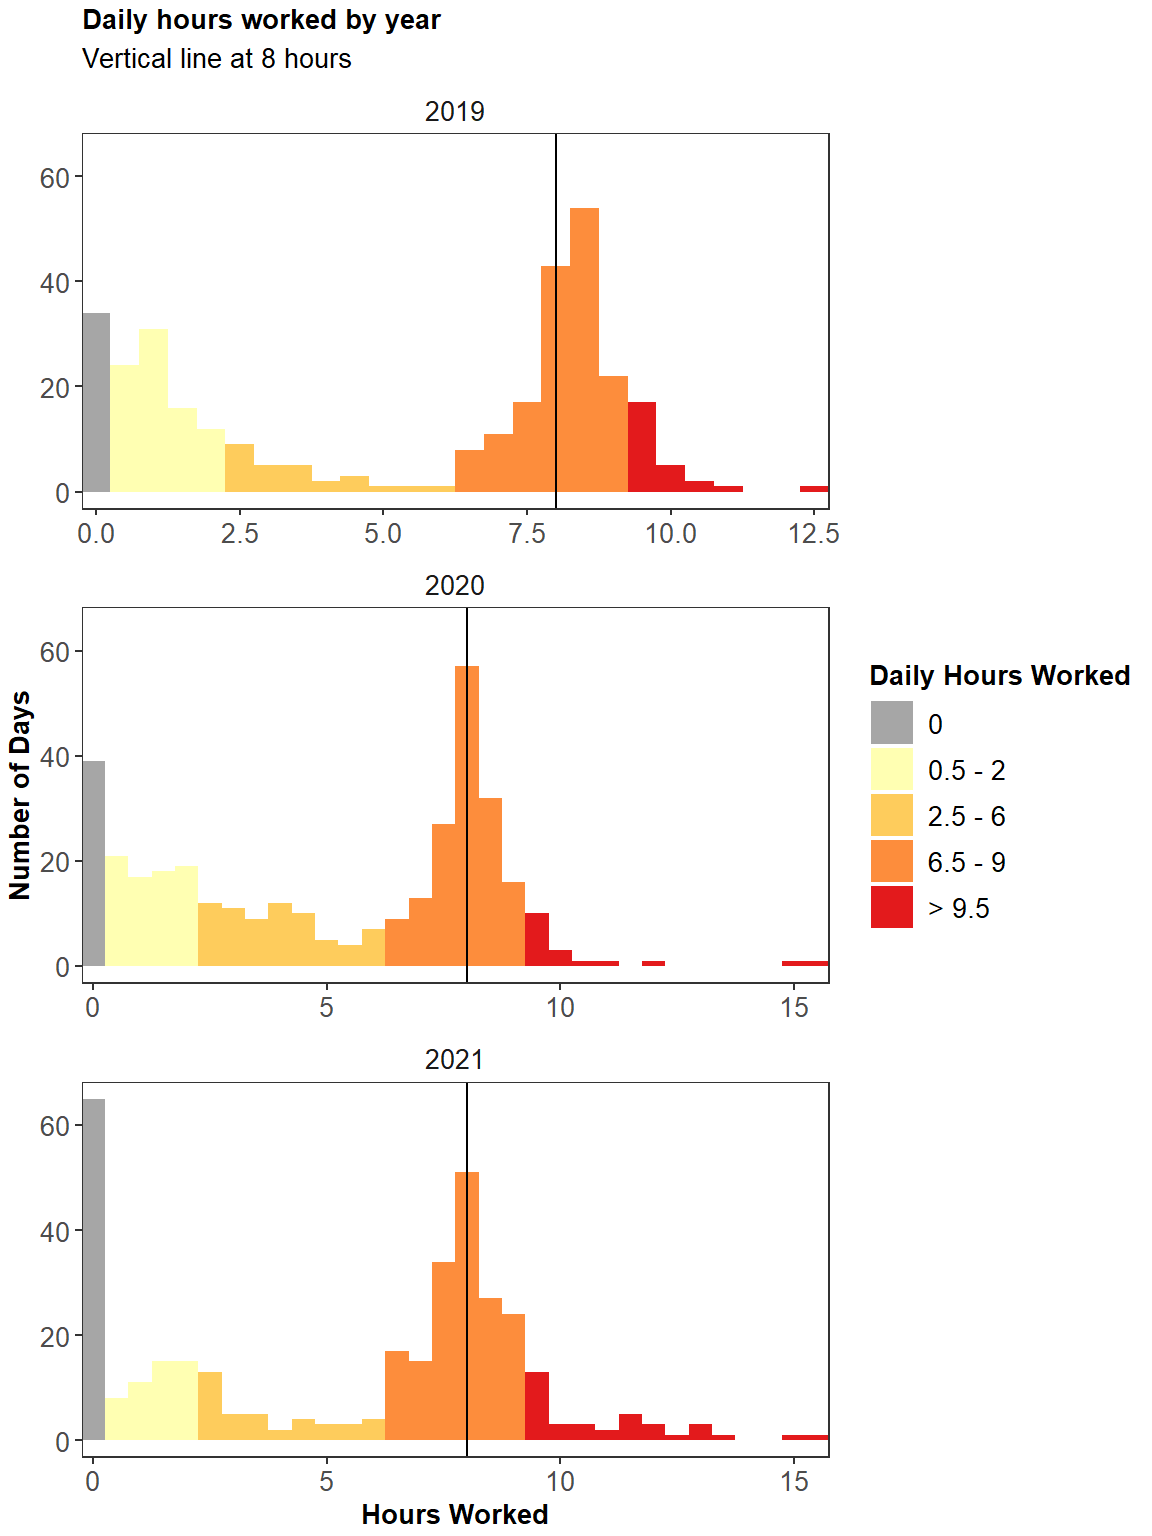
We can see that, in 2021, there are far more days with 0 hours (65 days in 2021, compared to 73 in 2019 and 2020 combined). In the histograms, we can see that this is compensated for with fewer days with 0.5 - 1 hours worked. Most of this increase was the result of a deliberate effort to not check my email on at least one of the two weekend days:
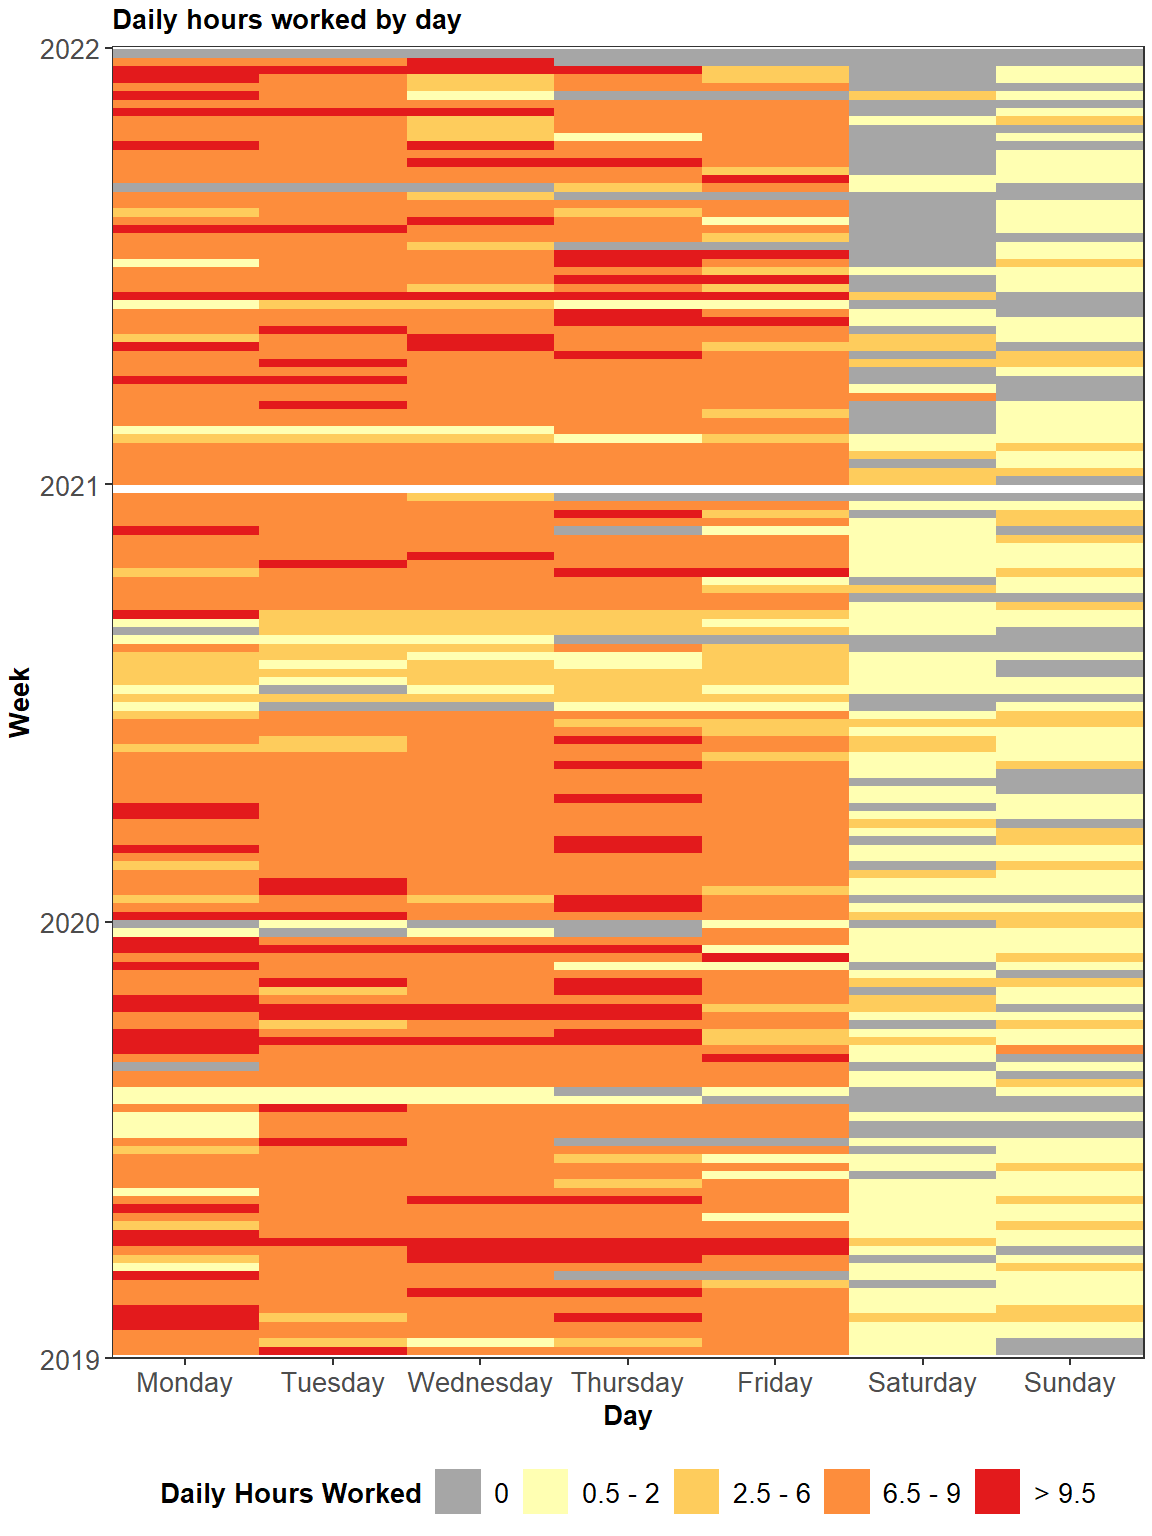
There are a lot more gray bars in 2021 compared to past years! This had the additional benefit of reducing the maximum consecutive days I worked (27 days in 2021, down from 61 in the prior two years) and an increase the maximum number of consecutive days off (9 days, up from 5 days in the two years prior).
What do I do when I’m working?
As a reminder, my six categories of work are:
talking= things that involved other people… meetings, seminars, zoom calls, etc.logistics= stuff that is generally unimportant (but sometimes necessary). emails, expense reports, etc.research= what pays the bills - writing, making presentations, data analysis, reading papers, etc.field= field work, which in last year’s posted I lumped into theresearchcategory but here have separated out.conference= anything at a conference/workshop. I define it broadly so it includes going out for meals with colleagues, etc. - basically, any time I am in the presence of other people.service= journal or grant reviews, committees, open science stuff, etc.mentees= talking to or working with someone who I am mentoring such as a postdoc or student.
Looking at the breakdown of activity for each year:
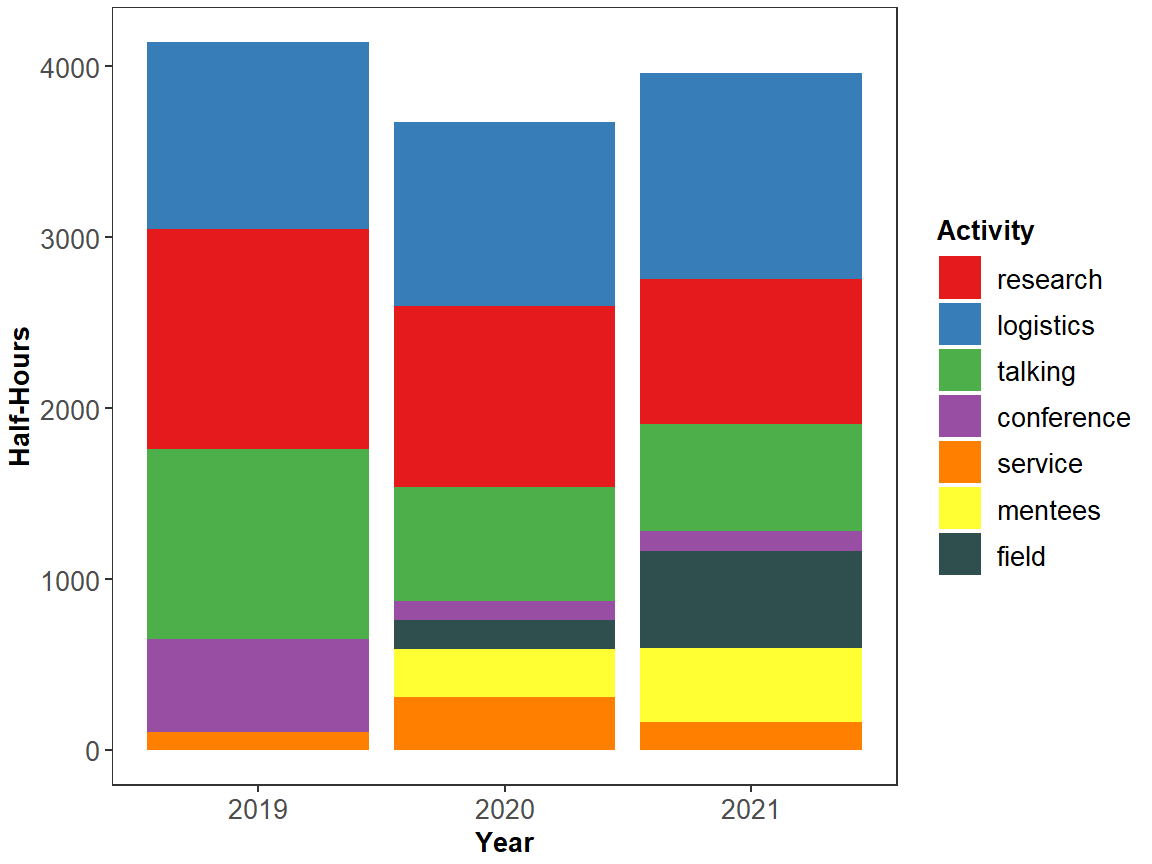
There was a dramatic increase in field in 2021, which I attribute to the start of our NSF AIMS project that requires lots of time outdoors. There has also been a general increase in logistics and mentees at the expense of research (note: I didn’t start logging mentees as a separate category until April 2020 so 2021 is the first full year of data there). Service is generally a tricky category because much of it (for example, the DEIB committee, etc.) is in the form of meetings so gets lumped into the talking category. Talking was remarkable consistent from year to year, despite the fact that I felt like I had more meetings than ever in 2021, so maybe that just indicates my meeting tolerance has decreased.
Across all of 2021, my time breaks down as:
logistics= 30.4%research= 21.4%talking= 15.9%field= 14.3%mentees= 11%service= 4.1%conference= 3%
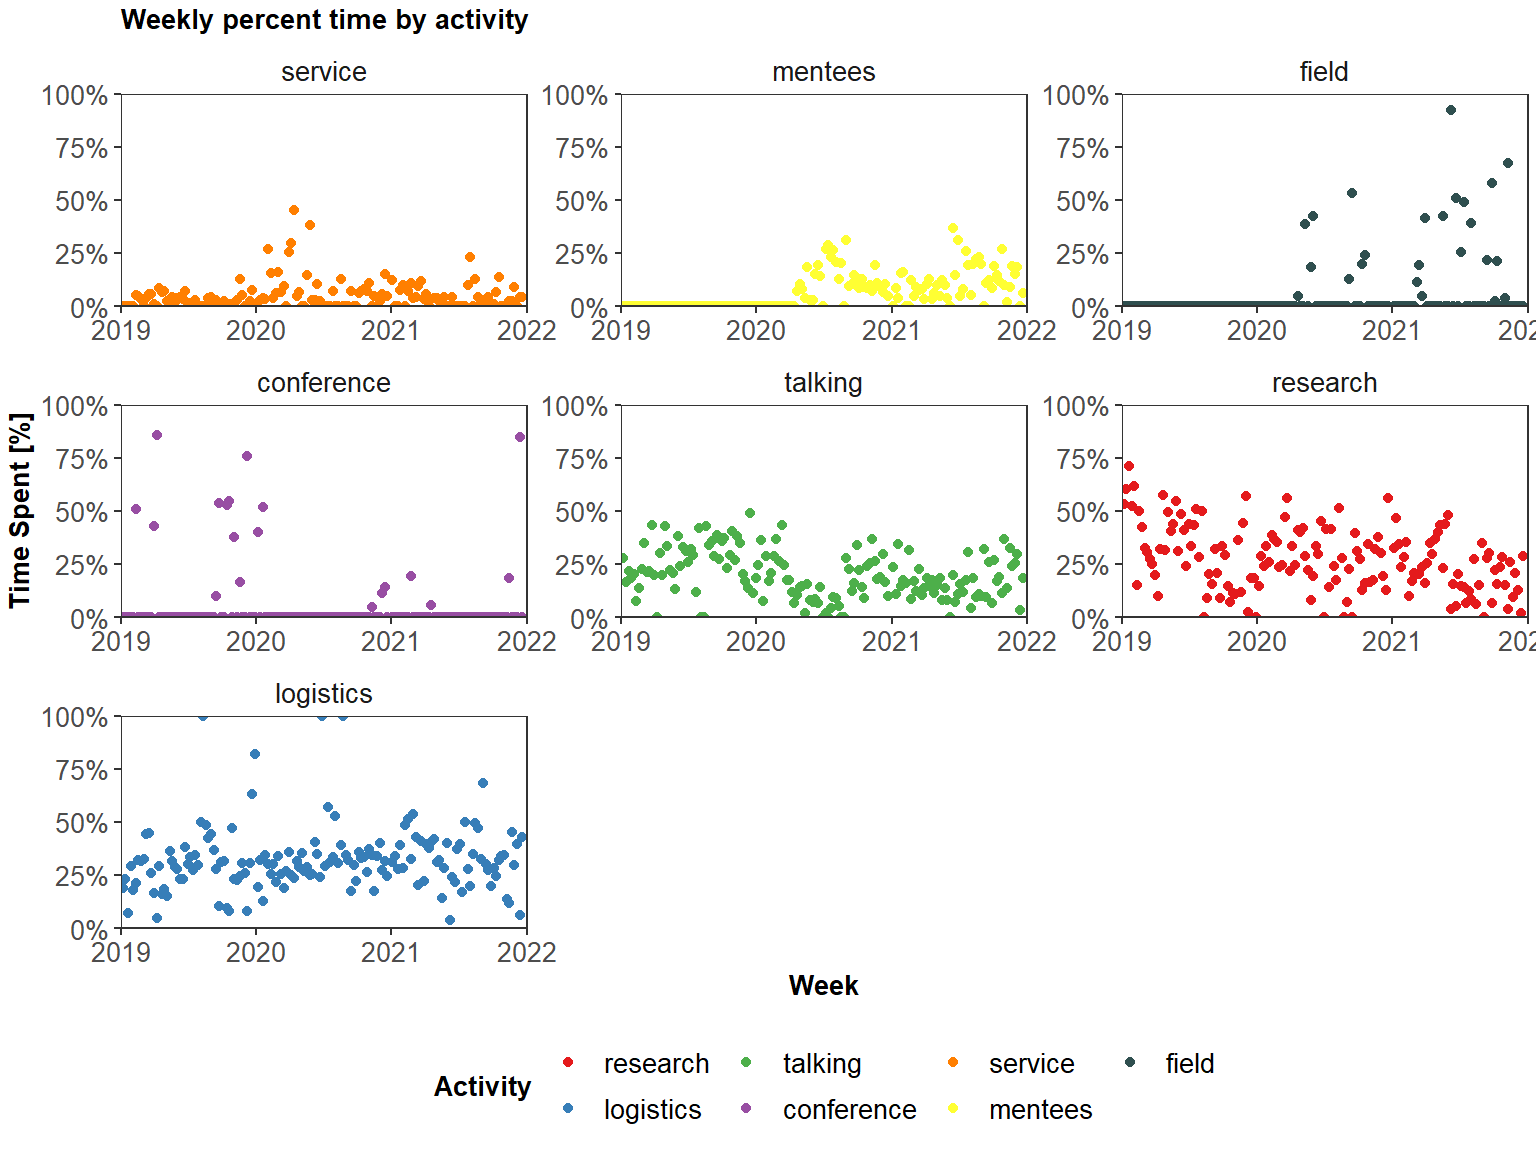
While some of these are pretty consistent, the trend in research is even more noticeable here. There is a significant (p<1e-5) trend of -0.13 percentage points per week, which comes out to ~-7 percentage points over the course of a year. Some of this is driven by an increase in field work compared to previous years - in 2021 I conducted field work on 34 days, compared to 18 days in 2020 and 0 days in 2019. There was also a slight, but not significant, positive trend in logistics of 0.03 percentage points per week.
How about evening work?
During the last couple months of the year, I felt like I regressed into working periodically in the evenings, in part because my wife was working evenings so I didn’t have anything to do after the kids were in bed. Here, I define the “evening” as anything after 5 PM, and exclude the field, conference, and travel categories since those are when I am away from home.
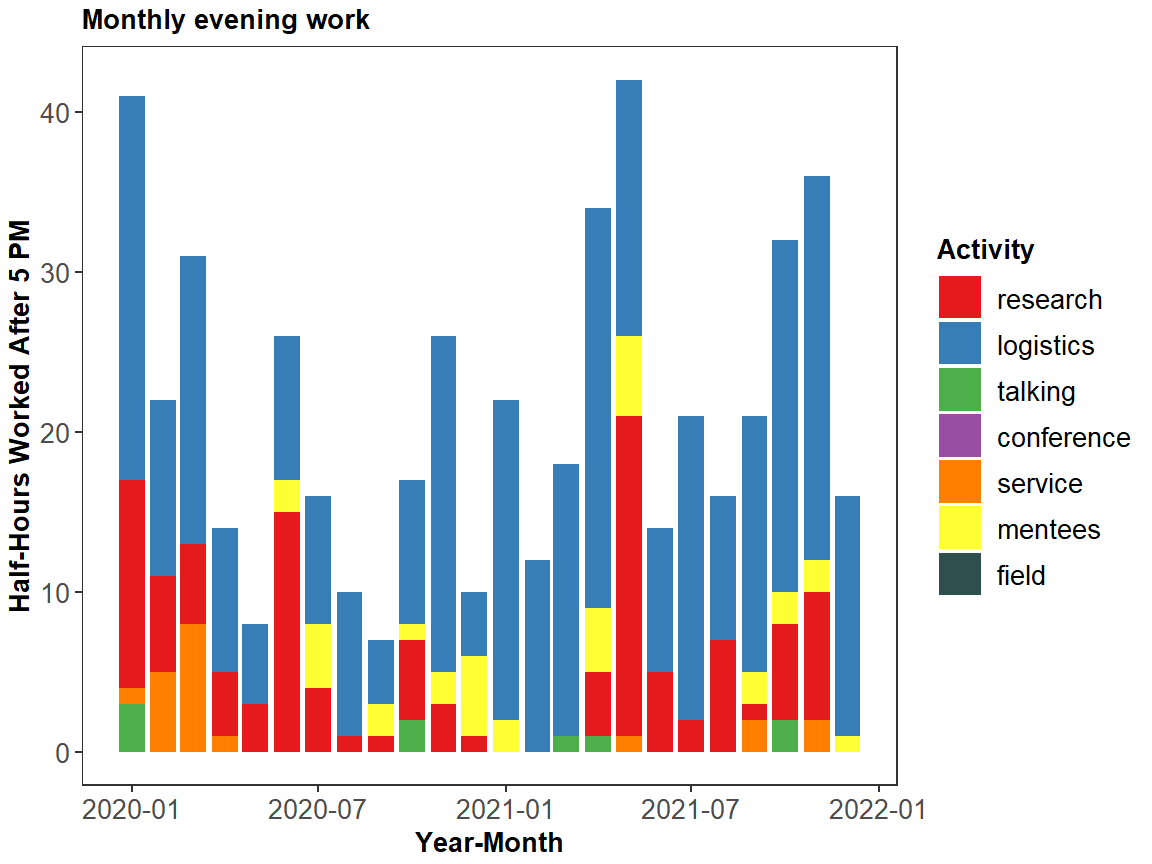
This suggests that my ability to resist to evening work ebbs and flows, with more hours in the spring and fall and fewer hours over the summer. In November, it approached 20 hours (40 half-hours), which averages about an hour per workday. December was low because I was at a conference for a week and on holiday for over a week. The large majority of this time is spent on logistics, the most boring category.
What’s next for 2022?
In 2021, I met one of my goals but not the other. I was happy that my plan to not work at least 1 day per weekend was a success, and led to a substantial increase in the number of 0-hour work days I had during the year. However, I wasn’t able to decrease the amount of time spent on logistics, which in fact has a slight (non-significant) upward slope.
For 2022, my goals are:
- Stem the significant downward trend in
researchtime. My 2022 target is to stabilize at an average no lower than 25%, which I will do by reserving the first couple hours of each day for research before getting in to other stuff. - My evening work is creeping upwards and needs to be stemmed. The 2022 target is to maintain an evening work level of no more than 10 hours/month.
- Reduce the number of
fielddays. I love field work, but 34 days is too many since field work typically involves longer hours and strains our family’s childcare schedule. I’m aiming for a max of 24 total days (2/month) next year.
Results forthcoming in a year!
Sam Zipper
HEAL PI; Assistant Scientist/Professor
I specialize in ecohydrology and hydrogeology of agricultural and urban landscapes.